1. Punjab College of Technical Education, Ludhiana
Course Instructor: Chitwan Kaur
Subject: Micro Economics
Subject Code: - BB 103
E-mail Id & Contact Number: chitwan15@gmail.com (+919888906881)
Total No. of Lectures: 40
Course Objective:
The Course is helpful in understanding the microeconomic concepts. This is a module in basic
microeconomic concepts and principles. It gives the student a fairly rigorous grounding in the
essential tools of microeconomic analysis. The aims and objectives of the module, together with
information on learning methods are given below.
After the completion of the course, students would be able to:
Understand modern micro economic concepts, theories and methods.
Apply micro economic models and methods in order to analyse government policies.
Grading criteria
Max Marks: - 100
Internal Assessment: - 40
External Assessment:-60
Break up for Internals
MSE: - 15 Marks (60)
Presentation:-5 Marks (20)
Tests:-10 Marks (2 Tests) (40)
Assignments:-4 Marks (2 Assignments) (16)
Case Study: - 3 Marks (2 Case Studies) (12)
Viva: - 3 Marks (12)
Break Up of the Course
1
2. LECTURE CASE ACTIVITY
NO TOPIC ASSIGNMENTS TESTS STUDY
1 Ice breaking Session
Micro economics: 1)Meaning
2) Nature
2-3 3) Scope
Basic Concepts of
Economics:
1) Static and Dynamic
Approaches
2) Equilibrium
4 3) Utility
Basic Concepts of
Economics: (contd)
4) Opportunity Cost
5) Marginal and
Incremental
5 Principles
Micro economics and
6 Business Assignment No. 1
Theory of Demand:
1) Nature of Demand
2) Individual Demand
7 3) Market Demand
Two Ways To Reduce The
quantity of Smoking Case
8 Demanded Study 1
Theory of Demand: (contd..)
4) Determinants of
demand
9
Theory of Demand: (contd..)
5) Elasticity of Demand
and its determinants
10-12 6) Measurement of Ed
Theory of Demand: (contd..)
7) Demand as
13 multivariate function
14 Activity 1
Theory of Consumer
Behaviour:
1) Utility Analysis
a) Cardinal utility
15 analysis
b) Law of
diminishing
16 marginal utility
2
3. c) Law of equi
17 marginal utility.
d) Consumer
Equilibrium
e) Ordinal utility
18 analysis
Theory of Consumer
Behaviour: (contd..)
2) Indifference Curve
Analysis
19-21
Theory of Consumer
Behaviour: (contd..)
22 3) Applications of IC
Theory of production and
costs:
1) concept of production
23-24 function
Theory of production and
costs:
( contd..)
2) production with one
25 and two variable inputs
Theory of production and
costs:
( contd..)
3) optimal input
26 combination
Theory of production and
costs:
( contd..)
4) theory of cost in short
27 run
Theory of production and
costs:
( contd..)
5) theory of cost in long
28-29 run
30 Revenue function
Theory of firm and market
organization:
31 1) Breakeven analysis
2) pricing under perfect
32 competition
3) pricing under
33 monopoly
34 4) price discrimination
35 The DeBeers Diamond Case
3
4. Monopoly Study 2
5) pricing under
monopolistic
36 competition Assignment 2
37 6) selling cost
7) pricing under
oligopoly: cournot
38 model
39 8) kinked demand curve
40 9) price leadership
Tests would be incorporated as per the schedule fixed in the coming days.
Assignments:
Students are supposed to submit the assignments on the given date and late submission
will not be allowed. Copying an assignment will award you a zero and NO
IMPROVEMENTS will be allowed for the same.
Assignment 1:
Each student will be allotted one product and you are supposed to get the response from 50
different people. What are the different factors they considered while purchasing that particular
product?
Price ______ Non availability of substitute’s ________
Availability ______ Possession of a complementary good ________
Variety ______ Income ______
Design ______ Expectation of price increase in future
Multiple use ______ Any Other, Please specify ________
Trying new product _______ Habit
Brand Loyalty ________
Summarize your research in one page as to what are the major three reasons of consideration
for the purchase of that product. Elasticity?
4
5. Assignment 2: E- Assignment
1. List down 5 different products that operate under monopolistic competition. Also
compare their prices with the substitutes of other companies.
2. List down 5 different products that operate under oligopoly form of market. Are the
prices charged justified or not? What are the measures taken by the government to check
the prices from being overcharged by the oligopolist?
Presentation:
The class would be divided into groups of 4 each. Each group will have 16 minutes for
case presentation. Following are the presentation topics:
1. Small segment cars in Indian Market
2. Ten richest people in India
3. Cycle Market of Ludhiana And Comparison between Hero Cycles and Avon Cycles
4. Product differentiation in Maggi
5. Contribution of Tourism in GDP
6. Demand of Teenagers: Price based or Fashion Based
7. Greece Debt Crisis
8. Hindustan Lever Ltd: Product Differentiation
9. Future of Rs 1 Lakh cars and impact on 2 wheeler sector
10. Boutique Hospitals in India and impact on Indian economy
11. 3G Mobile Technology
12. Professionalism in Bollywood and impact on Indian economy
13. Comparison of India and China
14. Business leaders in India
15. Emerging communication technologies
Case Study
5
6. Case Study 1
Two Ways To Reduce The quantity of Smoking Demanded
Public policymakers often want to reduce the amount that people smoke. There are two ways that
policy can attempt to achieve this goal.
One way to reduce smoking is to shit the demand curve for cigarettes and other tobacco
products. Public service announcements, mandatory health warnings on cigarette packages, and
the prohibition of cigarette advertising on television are all policies aimed at reducing the
quantity of cigarettes demanded at a given price. If possible these policies shift the demand curve
for cigarettes to the left.
Alternatively, policymakers can try to raise the price of cigarettes. If the government taxes the
manufacturers of cigarettes, for example, cigarette companies pass much of this tax on to
consumers in the form of higher prices. A higher price encourages the consumers to reduce the
numbers of cigarettes they smoke. In this case, the reduced amount of smoking does not
represent a shift in the demand curve. Instead, it represents a movement along the same demand
curve on a point with a higher price and lower quantity.
How much does the amount of smoking respond to changes in the price of cigarettes?
Economists have attempted to answer this question by studying what happens when the tax on
cigarette changes. They have found that 2% increase in price causes a 4% decrease in the
quantity demanded. Teenagers are found to be especially sensitive to the price of cigarettes. 10%
increase in price causes a 12% drop in teenage smoking.
A related question is how the price of cigarettes affects the demand for other drugs such as
marijuana. Opponents of cigarette taxes often argue that tobacco and marijuana are substitutes,
so that high cigarette prices encourage marijuana. There is another view which says that lower
cigarette prices are associated with greater use of marijuana. In other words, tobacco and
marijuana appear to be complements rather than substitutes.
6
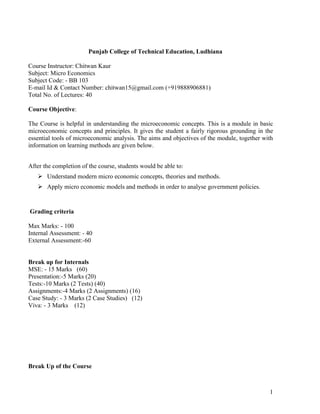
7. Y
A Policy to discourage smoking
D1 shifts the demand curve to the left
D2
P
A
Shift in the demand curve
Y Axis: price of cigarettes per pack
X
No. of cigarettes smoked per day
Case Study 2
The DeBeers Diamond Monopoly
A classic example of a monopoly that arise from the ownership of key source is DeBeers, the
South African diamond company. DeBeers controls about 80% of the world’s production of
diamonds. Although the firm’s share is not 100%, it is large enough to exert substantial influence
over market price of diamonds.
How much market power does DeBeers have? The answer depends in part on whether there are
close substitutes for its product. If people view emeralds, rubies and sapphires as good
substitutes for diamonds, then DeBeers has relatively little market power. In this case, any
attempt by DeBeers to raise the price of diamonds would cause people to switch to other
gemstones. But if people view these other stones as very different from diamonds, then DeBeers
can exert substantial influence over the price of its product.
7
8. DeBeers pays for large amount of advertising. At first, this decision might seem surprising. If a
monopoly is the sole seller of its product, why does it need to advertise? One goal of DeBeers
ads is to differentiate diamonds and other stones in the minds of the consumers. When their
slogan tells you that “diamonds are forever,” you are meant to think that same is not true of
emeralds, rubies and sapphires. If the ads are successful, consumers feel that diamonds are
unique, rather than as one among many gemstones and this perception will give DeBeers greater
market power.
Activity 1
Stage 1
You have Rs 200 to spend. You can buy any of the products in any combination, but you must
make sure you spend all of your Rs 200. You may not spend more than Rs 200. Complete the
table below.
Product Quantities
Can of coke (Rs25)
Snickers bar (Rs 30)
1 Bottle milk (Rs15)
Cookies (Rs 30)
Stage 2
Today is a new day and you have consumed all the food you bought above yesterday - you have
no food at all at the moment.
8
9. A global shortage of peanuts has pushed the price of a Snickers bar up to Rs 35. All other
product prices remain the same. You still have Rs 200 to spend (which you must spend all of).
Complete the table below with your new shopping list.
Product Quantities
Can of coke (Rs25)
Snickers bar (Rs 35)
1 Bottle milk (Rs15)
Cookies (Rs 30)
Stage 3 - Calculating Market Demand
Add together the requests from each individual in your group for each product in stages 1 and 2.
This will give you the Market Demand for each product. Complete the table below.
Quantities - Stage 1 Quantities - Stage 2
Product
(Snickers 30) (Snickers cost 35)
Can of coke
Snickers bar
1 Bottle milk
Cookies
You can now see the Market Demand for Snickers bars at each of the prices in stages 1 and 2.
Draw the demand curve for Snickers bars below. Draw a straight line through the two co-
ordinates on the graph.
What sort of relationship exists between price and quantity demanded?
Stage 4 - Introducing Price Elasticity of Demand
You can now see responsiveness of quantity demanded to a change in price for Snickers bars.
Calculate the Price Elasticity of Demand using the formula:
Percentage change in quantity demanded
Price Elasticity of Demand =
Percentage change in price
9
10. Hint: To calculate a percentage change, divide the change in the value of a variable by the initial
value, then multiply by 100. For example, if demand for cans of coke rises from 7 to 10, then the
change in value is 3. Dividing 3 by 7 (the initial value) gives 0.43. Multiplying by 100 gives
43%.
Stage 5
It is now Day 3 and the peanut crisis has eased. Snickers bars now cost Rs 30 again. You have
consumed all the food you bought on Day 2.
The generosity of the government has provided all students with a grant and they now have to
spend Rs 300. Complete the tables below with your new shopping list, ensuring you spend all of
your Rs 300
Product Quantities
Can of coke (Rs25)
Snickers bar (Rs 30)
1 Bottle milk (Rs15)
Cookies (Rs 30)
Stage 6 - Introducing Income Elasticity of Demand
Complete the table below to show market demand for Snickers bars in stages 1 and 5. Make sure
you add up the demand from individuals in your group. This shows the difference in market
demand at different income levels.
Quantities - Stage 1 Quantities - Stage 5
Product
(Income is Rs 200) (Income is Rs 300)
Can of coke
Snickers bar
Pint of milk
Mars bar
You can now see the Market Demand for Snickers bars at the different income levels in stages 1
and 5. Draw the demand curve for Snickers bars below.
10
11. You can now see responsiveness of quantity demanded to a change in income for Snickers bars.
Calculate the Income Elasticity of Demand using the formula:
Percentage change in quantity demanded
Income Elasticity of Demand =
Percentage change in income
Stage 7 - Introducing Cross Price Elasticity of Demand
Take another look at the table above under 'Stage 3 - Calculating Market Demand'. What
happened to the quantities demanded of the other goods when the price of Snickers bars
increased? The responsiveness of quantity demanded of one product to a price change in a
related product is known as the Cross Price Elasticity of Demand and can be calculated using the
following formula:
Percentage change in quantity demanded of
Cross Price Elasticity of Demand = x
Percentage change in price of y
Calculate the Cross Price Elasticity of Demand for cans of coke, bottles of milk and cookies, and
plot the shift in the demand curve on the templates below.
Activity 2
Economic Concepts Covered in the Lesson Plan:
• Law of Diminishing Marginal Utility
• Opportunity Cost
• Utility
a. On the paper, students will rate the benefit of consuming a piece of candy based on a scale of
1-10. In economics terminology, this benefit gained from consuming a good or service is called
utility. 1 represents the lowest utility and 10 the highest utility. Those in the audience will also
conduct their own “virtual” rating as you imagine your level of utility of consuming the piece of
candy.
b. The scribe will collect the ratings from the five volunteers.
11
12. c. Distribute one piece of candy to each of the five volunteers and give the following
instructions:
d. Consume the piece of candy and once the volunteer has finished level of utility, based on a
scale of 1-10, is recorded.
e. Distribute the second piece of candy, have the volunteers rate their utility, ask the scribe to
record the ratings. The audience will also rate the second piece. Explain the difference between
utility and marginal utility.
f. Distribute the third piece of candy following the same procedure as above.
g. What do the students notice about the data?
h. Why do you suppose the marginal utility ratings declined?
i. At what point did the marginal utility of consuming begin to decline?
j. Is it possible that this same decline in marginal utility would occur for other items that we
consume? How about a t-shirt? What do you predict would happen to the marginal utility ratings
for the second, third and fourth for the exact same t-shirt?
k. Can you think of an example when the Law of Diminishing Marginal Utility would not hold
true, where an individual’s satisfaction or benefit would continue to increase?
Activity 3
Select any one economic news and analyze its impact on the Indian economy.
Ask the students one day before to get the news in the class.
Activity 4
Word Finder
Terms to be discussed:
Interest rates, GDP, National income, Per capita income, Foreign exchange, how economy
works
Books:
Koutsoyiannis: Modern Microeconomics
H.L Ahuja: Micoeconomics
Question Bank
12
13. Short questions:
1. Explain the term micro economics
2. Explain the opportunity cost
3. What do mean by the term demand
4. Explain marginal utility
5. What is arc elasticity of demand
6. Mention the various assumptions of perfect competition.
7. Give assumptions of indifference curve
8. Explain the term individual demand curve
9. Why demand curve slopes downward
10. Explain the break even analysis
11. rWhat is the scope of microeconomics
12. What is the meaning of price elasticity of demand
13. Show price effect with the help of indifference curve.
14. What are the main assumptions of utility analysis?
15. Distinguish between fixed costs and variable costs.
16. Show the relationship between average revenue and marginal revenue.
17. What ate the features of perfect competition.
18. Define selling costs
19. What do you understand by elasticity of demand
20. What is market price.
21. Define the term income effect
22. Explain the term implicit and explicit costs
23. What do you mean by returns to scale.
24. What is kinky demand curve
25. Distinguish between ordinal no. and cardinal no.
26. What do mean by average fixed cost?
27. What do mean by equi marginal principle
28. Define equilibrium
29. How do tates and preferences of consumer affect the demand of a commodity?
30. What do you mean by production function?
31. What is indifference map
32. Define price effect
33. What are the features of an oligopoly market
34. What are the features of monopolistic competition?
35. What is the relation between total utility and marginal utility
36. What is indifference curve
37. What is the importance of elasticity of demand
38. Why short run cost curve is U shaped
39. Under what conditions can a monopoly firm attain equilibrium
40. Explain oligopoly
Long questions:
1. Discuss the uses of microeconomics
2. Explain the properties of indifference curve.
3. Explain the condition of perfect competition. How is the price determined under
the conditions of perfect competition
13
14. 4. Explain the law of equi marginal utility
5. What is demand curve? Why does the demand curve slope down to the right?
Are there any exceptions to it?
6. What is elasticity of demand? How is it measured?
7. Examine the importance of microeconomics in business studies?
8. Define price elasticity of demand. What are the factors on which price elasticity
of demand depend upon?
9. Explain how consumer attains equilibrium, with the help of indifference curve.
10. Why long run average cost curve is called as planning curve?
11. What is break even analysis? What are its assumptions?
12. Explain the scope of microeconomics
13. Explain the law of diminishing marginal utility. Discuss its importance.
14. What is monopolistic competition? How is price determined under it?
15. Explain the various methods of measuring price elasticity
16. When price discrimination is possible profitable and beneficial to society?
17. Discuss law of diminishing returns. Does it apply to agriculture
18. What do you mean by demand? Give factrs which determine demand of a
commodity?
19. What is law of diminishing marginal returns?
20. Discuss how price and output is determined under monopoly market?
21. Explain price and output determination under cournot model.
22. Explain the features of monopolistic competition. How is it different from
oligopolistic?
23. What is opportunity cost? Give some examples of opportunity cost. How these
costs are relevant for managerial decisions.
24. Distinguish between microeconomics and macro economics
25. Distinguish between arc elasticity and point elasticity of demand
26. Write a note on traditional theory of cost.
27. sWrite a note on price leadership model.
http://marketingpractice.blogspot.com/2006/07/dove-mildest-one.html
14